

Every geography
One connected economic view
Analyze counties, states, the nation, reservations and trust lands without buying geography add-ons.
the intelligent economic analysis platform
Lumecon brings your organization’s records, trusted public data and a regional economic model into one reviewable workflow. Cedar structures the inputs and flags uncertainty; you approve the assumptions, Cedar Impact calculates the results and every estimate keeps its source trail.
Built for the real economy

Public infrastructure

Tribal economies

Advanced manufacturing
Photography is illustrative and does not identify Lumecon customers.
Why Lumecon
Build an analysis once, then update, compare and report it without reconstructing the process. Why organizations choose Lumecon, or request free access.
Every geography
Analyze counties, states, the nation, reservations and trust lands without buying geography add-ons.
Unlimited analyses
Update budgets, compare scenarios and return to prior analyses without starting the process again.
Cedar
Cedar organizes documents, proposes mappings and flags unresolved questions before values enter the model. Meet Cedar.
Organizational context
Use one reviewable workflow across governments, universities, nonprofits, businesses, Tribal Nations and client work.
Inside the product
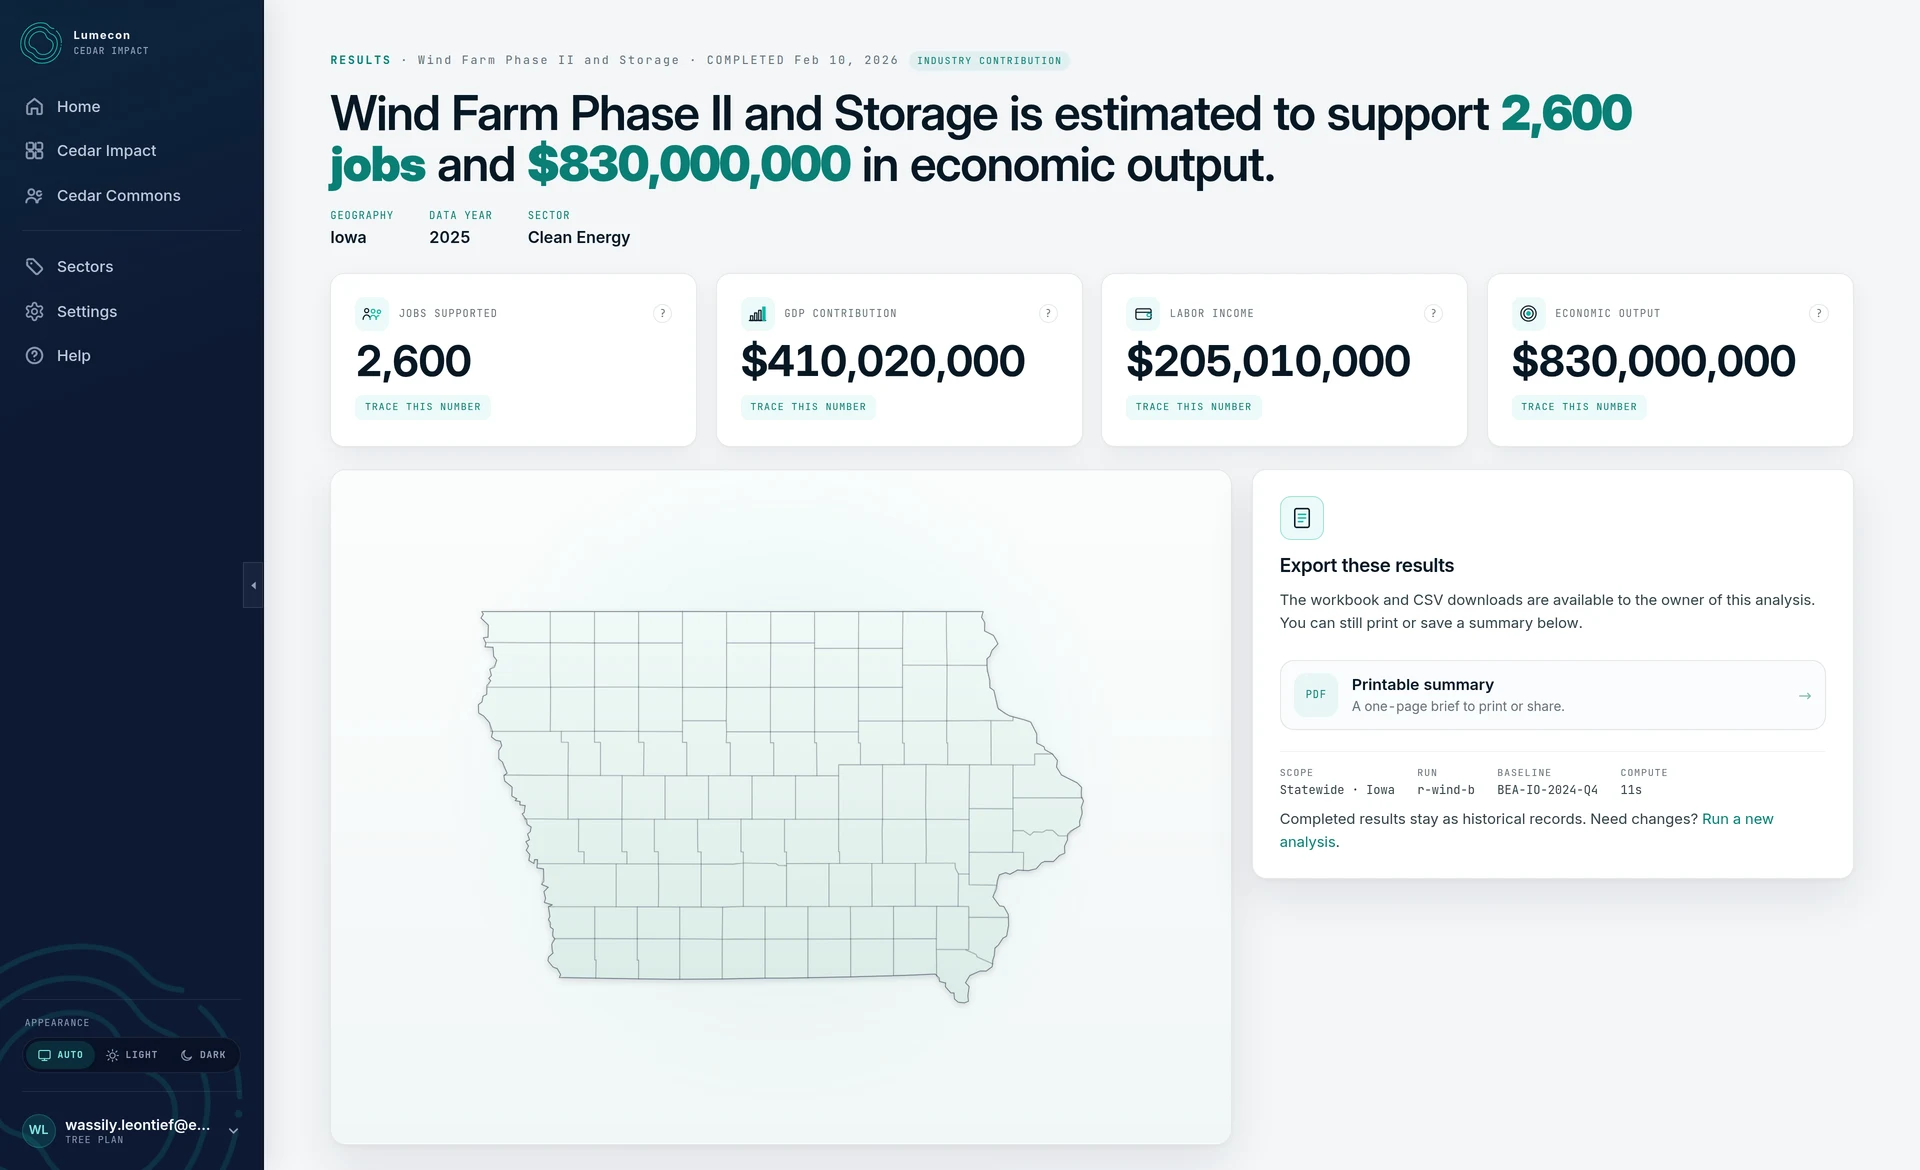
Cedar Impact keeps source data, approved assumptions and model layers attached to each figure, so reviewers can examine how a result was produced.
Screenshots show illustrative sample analyses.
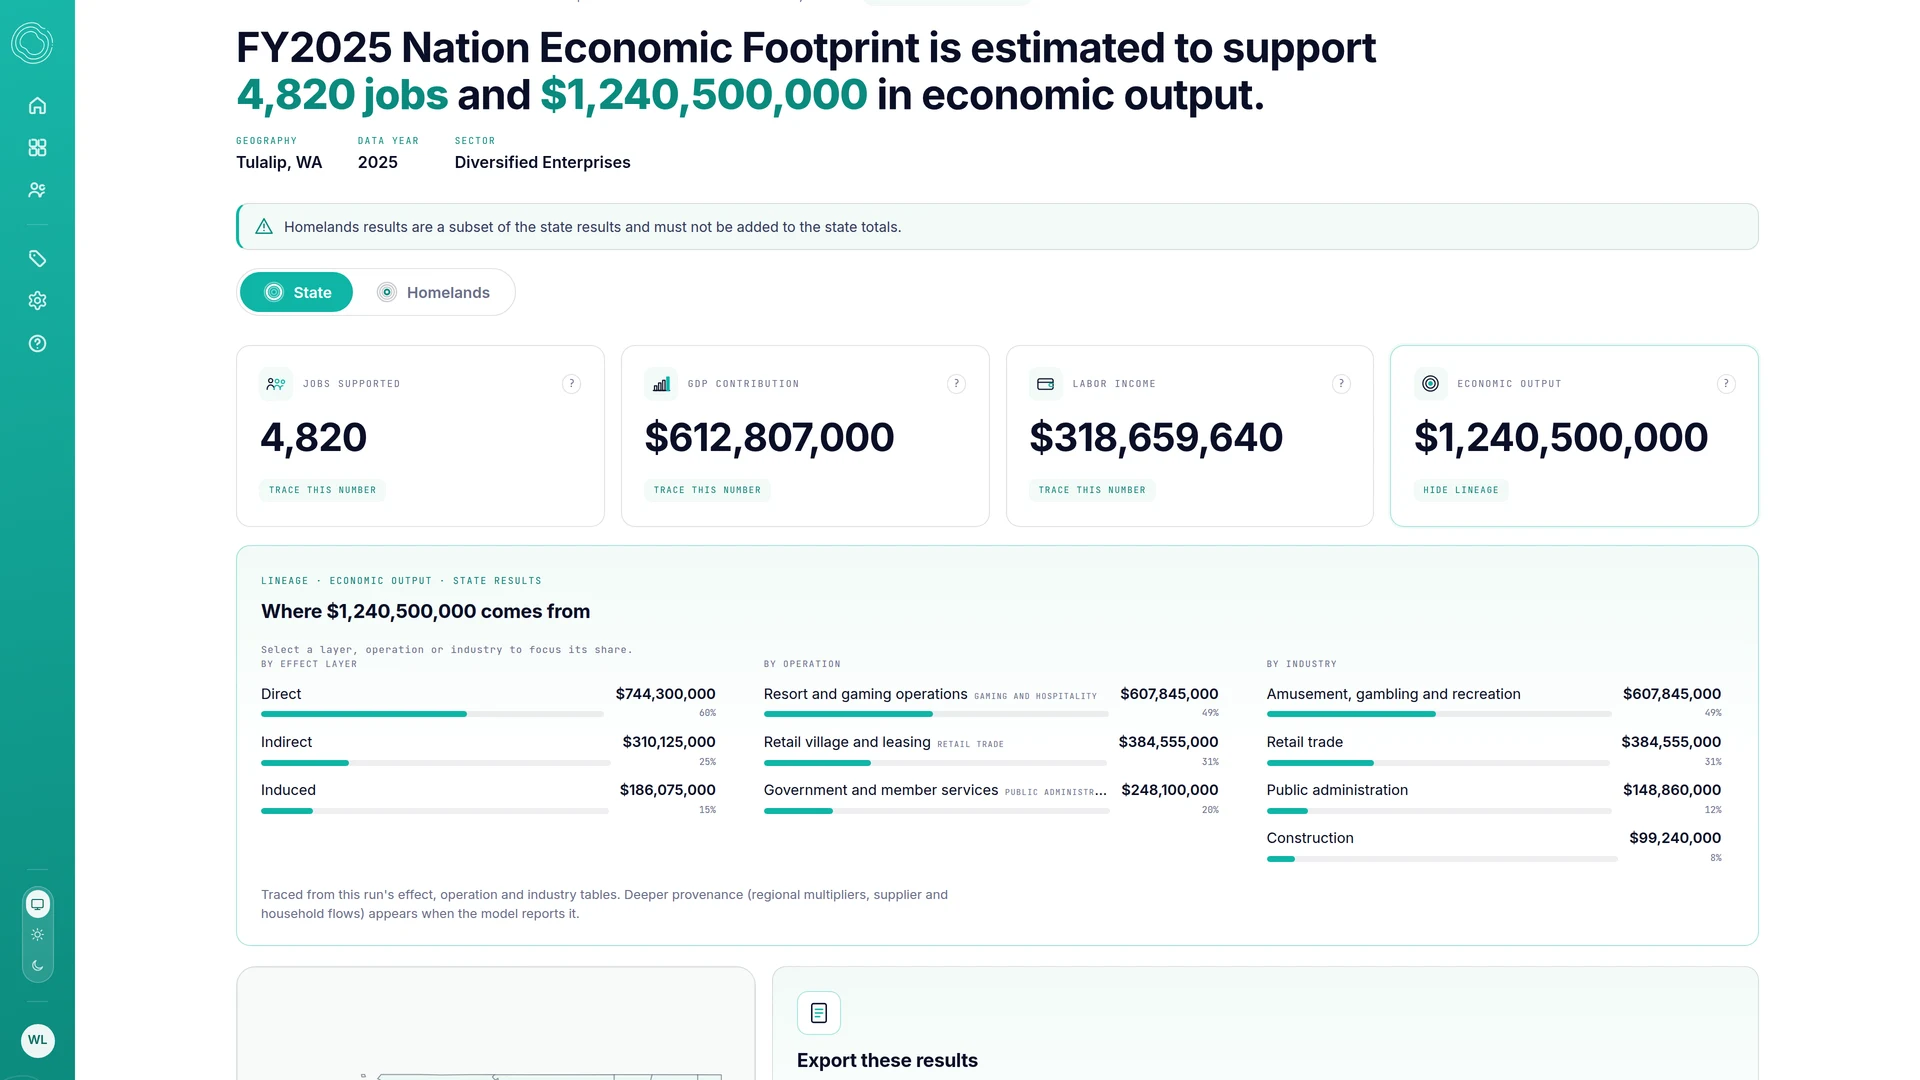
Cedar ImpactResult lineage
Each headline figure includes a “Trace this number” control. Follow a result through direct, indirect and induced effects, the operations that generate them and the industries where they land.
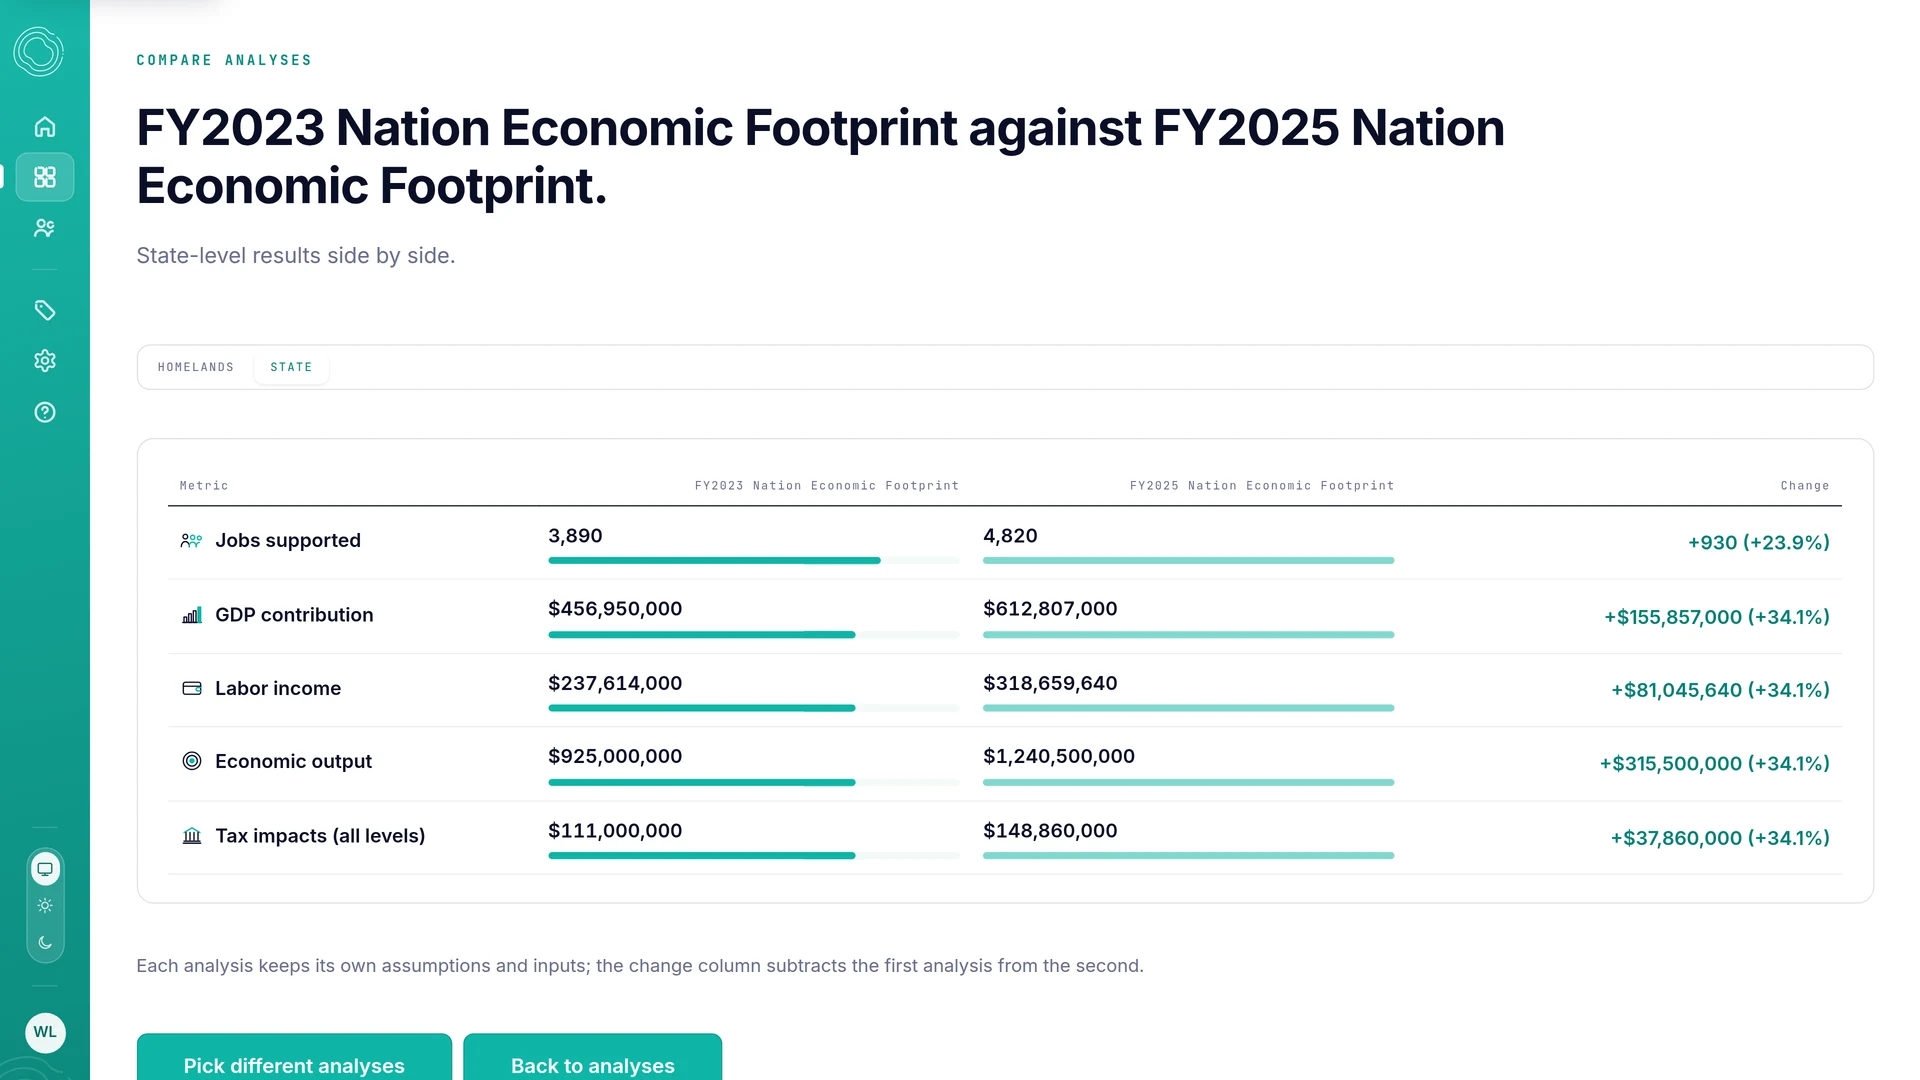
Cedar ImpactAnalysis comparison
Put years or scenarios side by side and see the change in jobs, labor income, GDP contribution, economic output and tax impacts. When the next budget cycle begins, the comparison is already there.
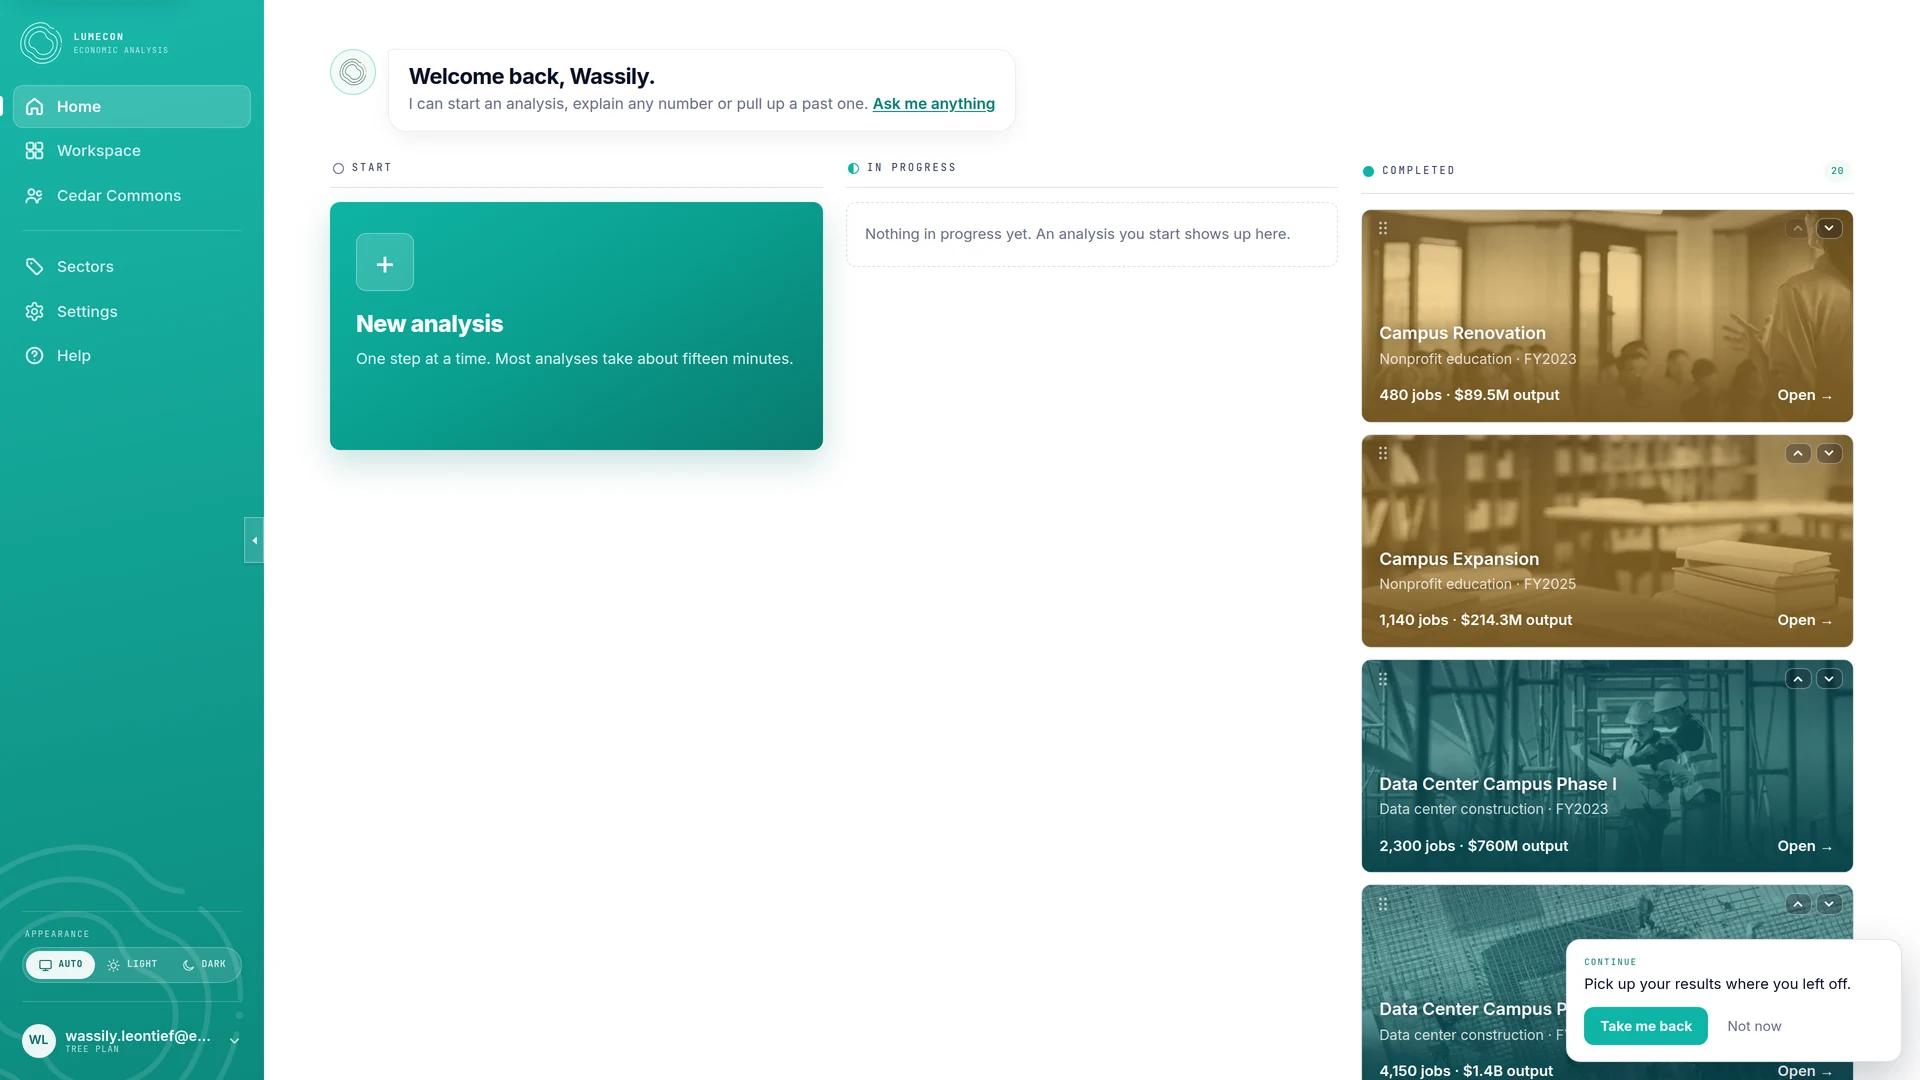
Cedar ImpactAnalysis history
Drafts, completed analyses, comparisons and exports stay together in your Workspace, ready to reopen, compare or export as a workbook, CSV tables or a printable summary.
Built for scrutiny
Lumecon combines established economic methods, current public data and a reviewable product workflow. Its team includes economists, data scientists and engineers with experience at Federal Reserve institutions and leading universities.
Read the methodologyGet started
Request free access during the private beta. Once admitted, you can upload your documents, build an analysis and review direct effects before choosing a paid plan. No credit card is required.
Not sure what you would run first? Plan your first analysis, or write to contact@lumecon.ai.
Hi, I'm Cedar. I'm here to help with anything about Lumecon or economic impact analysis.


